> ## Documentation Index
> Fetch the complete documentation index at: https://docs.asserto.ai/llms.txt
> Use this file to discover all available pages before exploring further.
# Confusion Matrix
> Visualize classification with Confusion Matrix
## Confusion Matrix for Multi-Class Classification
A **confusion matrix** is a key tool for understanding the performance of classification tasks, especially when you have more than two possible output categories (multi-class). It summarizes how often each class was correctly predicted versus misclassified.
Here's an example of a confusion matrix from an intent classification prompt with five possible intents:
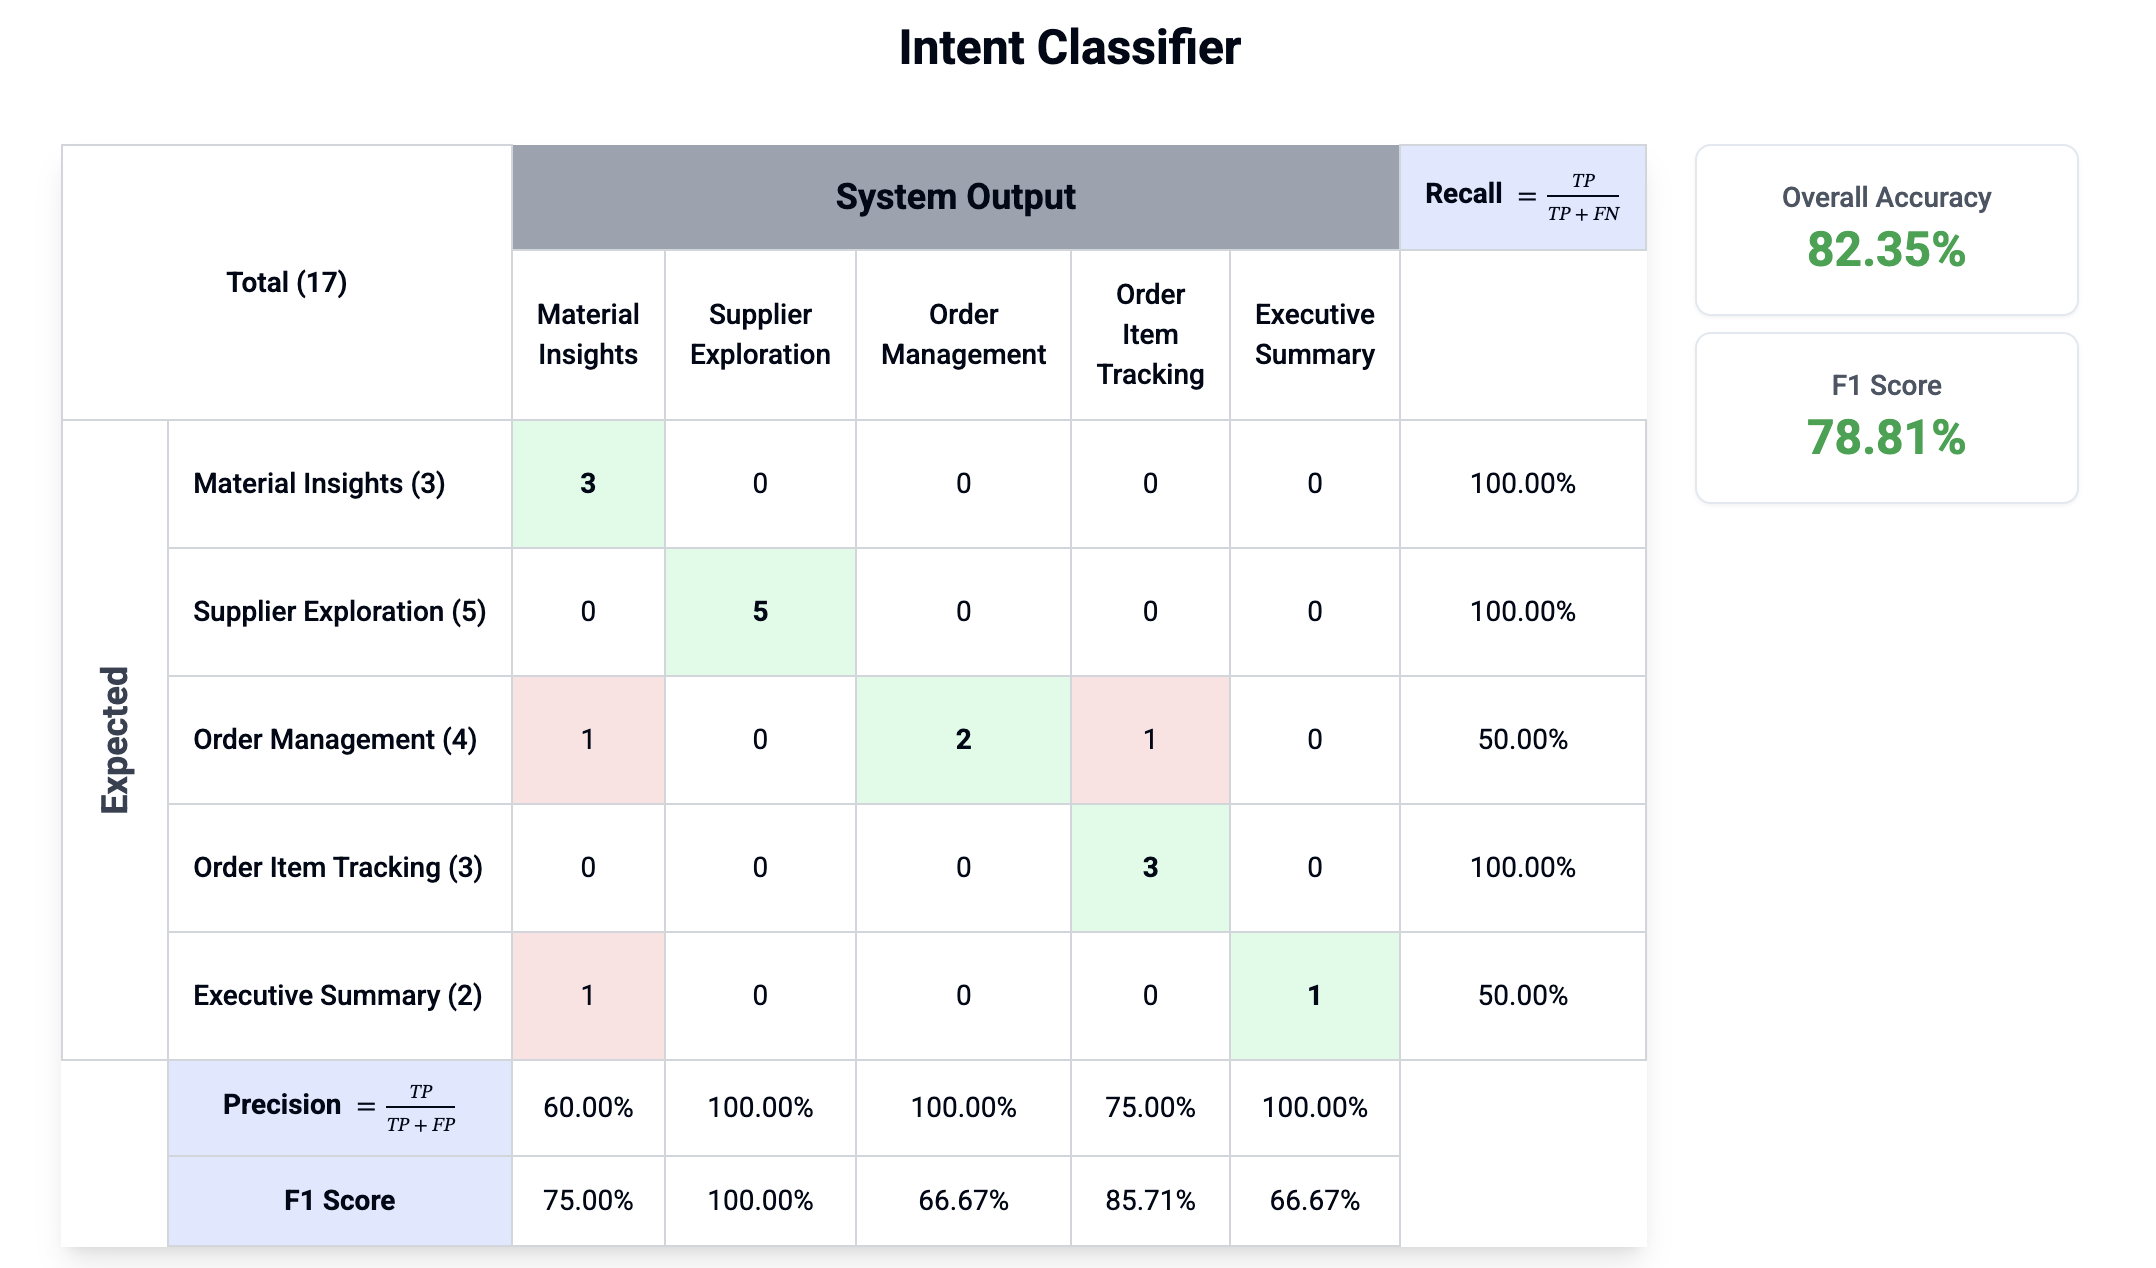 * **Rows**: Expected (ground truth) categories
* **Columns**: System output (predicted categories)
* **Diagonal cells**: Correct predictions; off-diagonal cells indicate mistakes
* **Per-class Precision, Recall, F1 Score**: Show which categories need improvement
* **Overall metrics**: Quick view of total accuracy and F1
***
## Example: Intent Classification & LLM Tool-Use
Suppose your LLM prompt classifies user queries into intents such as "Order Management" or "Executive Summary." This is a classic multi-class classification problem.
Similarly, LLM "tool-use" (function calling) is evaluated in the same way: the LLM chooses one function from a set (e.g., `getWeather`, `lookupOrder`, `summarizeReport`). Each tool or function is treated as a class, and you can use a confusion matrix to analyze accuracy and errors for each function.
***
## Using Confusion Matrices in Asserto AI
You can easily set up and visualize a confusion matrix for your classification or tool-use prompts in Asserto AI. Here’s how:
On your prompt's page, go to the Config tab. Under Metrics, click Add Metric.
If the prompts outputs JSON, select the property in the result JSON that the visualization will be based on.
Set the visualization type to Confusion Matrix. Enter all possible classes/labels your prompt can output (e.g., intent types or function names).
Switch to the Test Cases tab. Add a new test case with input data.
Within the test case, add an assertion. Select the same property as you created the visualization. Set the operation to equal. The system will automatically link the visualization based in the property.
Go to the Test Runner tab and run your test suite.
After running tests, open the Session Page in the dashboard. Here you’ll see the confusion matrix visualization, with per-class and overall accuracy metrics.
Confusion matrices help you evaluate both classification from text and JSON outputs and tool/function-calling prompts with multiple categories.
***
Use these visualizations to iterate quickly and confidently on your prompt and function-calling logic!
* **Rows**: Expected (ground truth) categories
* **Columns**: System output (predicted categories)
* **Diagonal cells**: Correct predictions; off-diagonal cells indicate mistakes
* **Per-class Precision, Recall, F1 Score**: Show which categories need improvement
* **Overall metrics**: Quick view of total accuracy and F1
***
## Example: Intent Classification & LLM Tool-Use
Suppose your LLM prompt classifies user queries into intents such as "Order Management" or "Executive Summary." This is a classic multi-class classification problem.
Similarly, LLM "tool-use" (function calling) is evaluated in the same way: the LLM chooses one function from a set (e.g., `getWeather`, `lookupOrder`, `summarizeReport`). Each tool or function is treated as a class, and you can use a confusion matrix to analyze accuracy and errors for each function.
***
## Using Confusion Matrices in Asserto AI
You can easily set up and visualize a confusion matrix for your classification or tool-use prompts in Asserto AI. Here’s how:
On your prompt's page, go to the Config tab. Under Metrics, click Add Metric.
If the prompts outputs JSON, select the property in the result JSON that the visualization will be based on.
Set the visualization type to Confusion Matrix. Enter all possible classes/labels your prompt can output (e.g., intent types or function names).
Switch to the Test Cases tab. Add a new test case with input data.
Within the test case, add an assertion. Select the same property as you created the visualization. Set the operation to equal. The system will automatically link the visualization based in the property.
Go to the Test Runner tab and run your test suite.
After running tests, open the Session Page in the dashboard. Here you’ll see the confusion matrix visualization, with per-class and overall accuracy metrics.
Confusion matrices help you evaluate both classification from text and JSON outputs and tool/function-calling prompts with multiple categories.
***
Use these visualizations to iterate quickly and confidently on your prompt and function-calling logic!